At some point, software developers or processor developers need to check and debug their code. They can do this at different levels, for example looking at waves or parsing printouts, but the preference is to check code in an interactive session. The debugger facilitates the interactive session by accepting developers’ commands, executing them, and showing the results. For example, showing a variable value while being stopped at a particular line of the code. In this blog post, let’s focus on the LLDB, a debugger developed under the LLVM project.
Debuggers and customization
Debuggers usually support multiple targets such as x86, Arm, or RISC-V. They have an embedded knowledge of these targets (also known as ABI), such as which registers are visible to a programmer, which instructions the target has, or how the memory map looks like. However, RISC-V brought a new dimension. RISC-V supports and endorses custom extensions, which means that the processor may have more instructions and/or registers that are interesting for developers, yet the standard RISC-V target is not aware of them.
This is something that Codasip solutions handle perfectly. The beauty of it? The solutions scale not only for RISC-V architectures, but for pretty much any architecture described using Codasip Studio tools (that is, custom processors).
The LLDB and its architecture
The LLDB (Low-Level DeBugger) is a next-generation debugger that lives under the LLVM project and reuses a lot of code from an LLVM compiler, such as expression evaluation. It includes all standard features such as:
- Breakpoints, watchpoints
- Program flow control (step in/out/over, continue, interrupt)
- Variables
- Registers
- Memory
The LLDB architecture is very well-designed and modular. Modular in the sense that:
- It is prepared for extensions.
- It leverages a plug-in architecture.
LLDB Plug-ins
Independent plug-ins handle functionalities such as:
- Disassembly of instructions.
- Start-up of the executable on different platforms.
- Support of various executable and debug formats, or support for different high-level languages, such as C or C++.
Each plug-in type has a predefined API that a plug-in must implement. Besides the plug-ins, the LLDB has a core body that leverages plug-ins and holds information about the supported architectures/targets and their features. The target then connects the dots among the plug-ins and ABI. For example, the RISC-V target knows that the ELF is the default executable format, and that the RISC-V architecture may be either 32-bit or 64-bit, that it has 32 registers, etc.
Although the LLDB is flexible in the baseline, to leverage Custom Compute to its maximum, it must be enhanced.
Codasip enhancements to LLDB
We’ve enhanced the LLDB using plug-ins to add support for:
- Codasip simulator, RTL simulators, or JTAG as the platform
- Process running on top of Codasip simulator or on FPGA/ASIC
- Configurable ABI for not-only RISC-V processors
- Configurable disassembler
- CodAL language (see below)
- Etc.
We have also enhanced the LLDB core with support for dual-stack architectures, Harvard architectures, support for 16-bit architectures, and many other big and small improvements.
For Custom Compute however, we need one more step. As state above, for example, designers may add new instructions or add new registers. In this case, the LLDB plug-in system is not enough. Of course, Codasip Studio may generate code for the plug-ins, however the compilation time is then significant.
Who would like that? Nobody. Everyone wants to have fast turnarounds when developing processors (seconds to minutes, not longer than that).
Adding a configuration level
So, we have added a new configuration level. This configuration level allows for instance the addition (or removal) of new registers, instructions, or memory maps without plug-ins recompilation.
- The configuration itself is generated automatically from a processor model and is passed to the LLDB when it is started.
- The LLDB then loads the configuration file and updates the loaded plug-ins. This way, we get the benefits from the built-in plug-ins, processor customization, and everything is done in seconds.
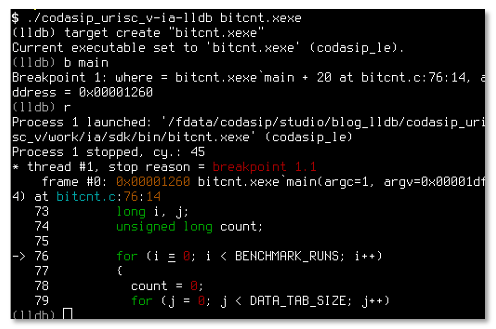
The following example shows the command line interface of the LLDB.
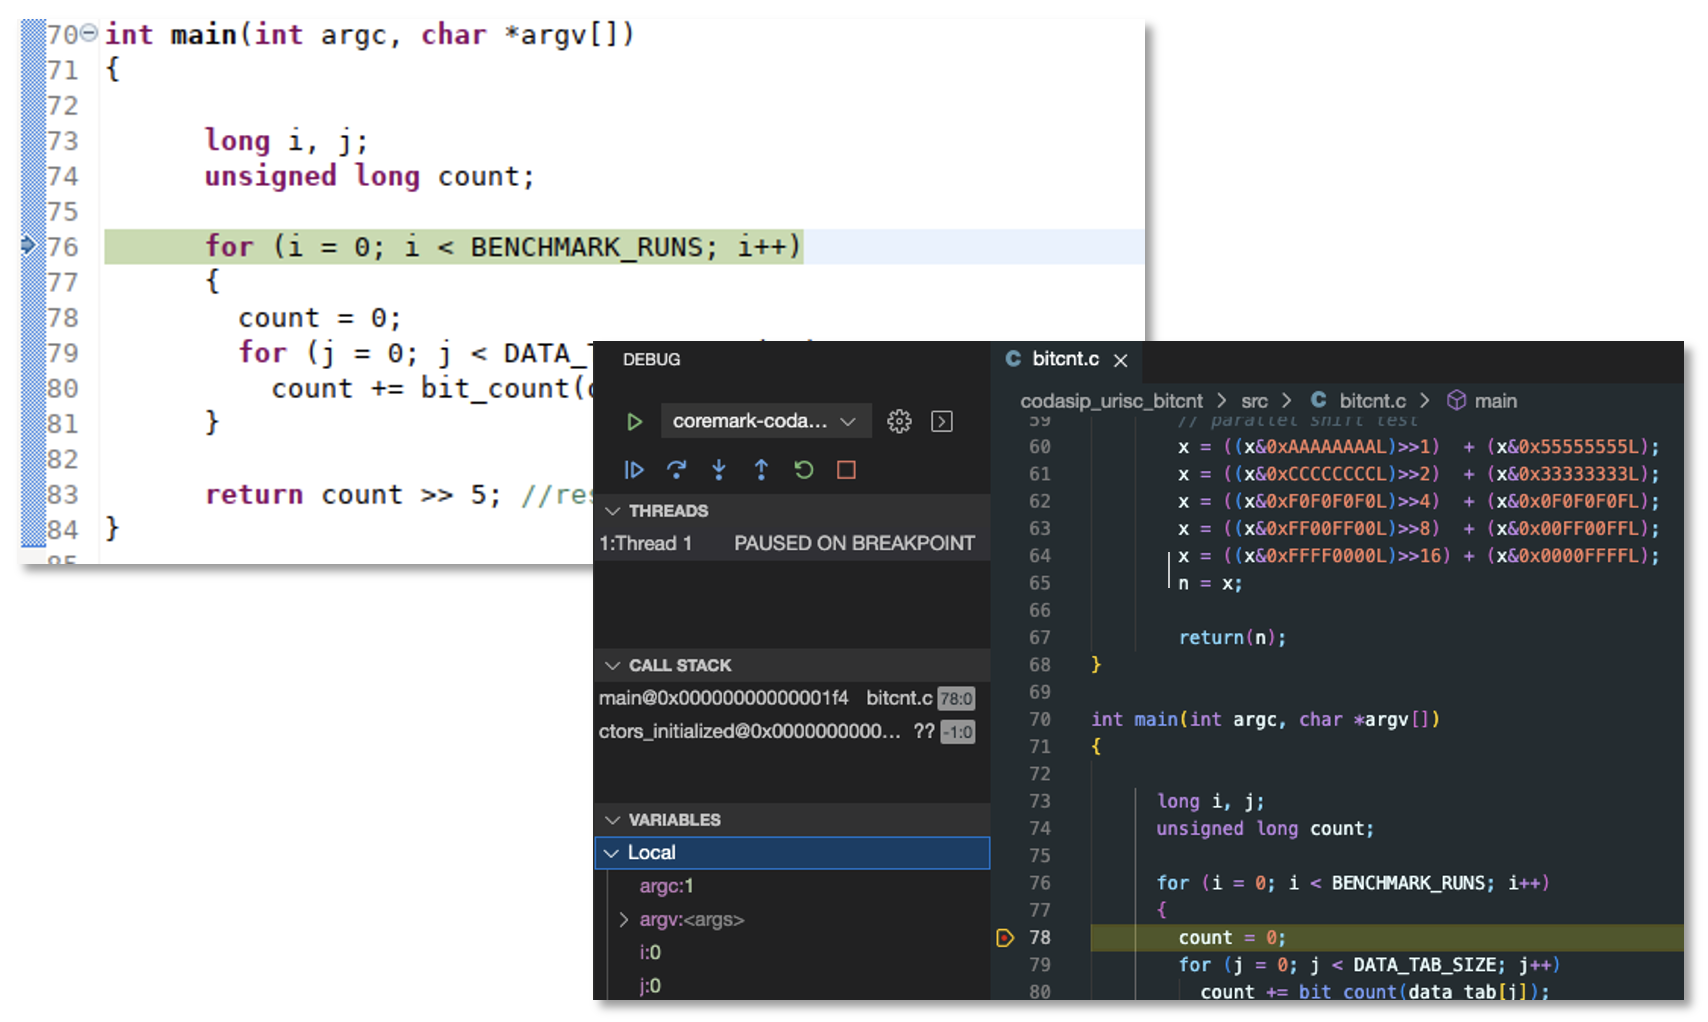
Using a Machine Interface or Python, the LLDB may be integrated into IDEs as well.
What about processor debugging?
So far, we have talked about software and C/C++ debugging. But, as I stated at the beginning of this blog, processor designs need debugging too. Codasip Studio offers more than standard wave debugging.
We have also enhanced the LLDB with support for CodAL language. This feature allows debugging of the processor directly in CodAL without having to inspect waves in RTL. In other words, the LLDB can do all the standard debugging things, such as accessing CodAL variables, stepping, or setting breakpoints, all at CodAL level. Designers may easily go from C/C++, through assembly, to CodAL code. The following image shows this scenario.
What else?
The LLDB includes other nice features that we haven’t described in this blog. A very nice one is scripting using Python. This allows seamless and smooth integration into your CI/CD or other automation frameworks. It is supported on major platforms, such as Windows, Linux, or MacOS (all supported by Codasip Studio too). The LLDB can be integrated into most IDEs (for example, VS Code, Eclipse, etc.) using a Machine Interface protocol or Python. To mention one more, there is a nice command map for those who are moving from GDB to LLDB. Join the LLDB community and Codasip to explore more LLDB capabilities and features!
And in case you missed it, I also wrote a blog on retargetable LLVM compiler for RISC-V.
